Logging Using Elasticsearch and Kibana
On the Google Compute Engine (GCE) platform, the default logging support targets Stackdriver Logging, which is described in detail in the Logging With Stackdriver Logging.
This article describes how to set up a cluster to ingest logs into Elasticsearch and view them using Kibana, as an alternative to Stackdriver Logging when running on GCE. Note that Elasticsearch and Kibana cannot be setup automatically in the Kubernetes cluster hosted on Google Kubernetes Engine, you have to deploy it manually.
To use Elasticsearch and Kibana for cluster logging, you should set the following environment variable as shown below when creating your cluster with kube-up.sh:
KUBE_LOGGING_DESTINATION=elasticsearchYou should also ensure that KUBE_ENABLE_NODE_LOGGING=true (which is the default for the GCE platform).
Now, when you create a cluster, a message will indicate that the Fluentd log collection daemons that run on each node will target Elasticsearch:
$ cluster/kube-up.sh
...
Project: kubernetes-satnam
Zone: us-central1-b
... calling kube-up
Project: kubernetes-satnam
Zone: us-central1-b
+++ Staging server tars to Google Storage: gs://kubernetes-staging-e6d0e81793/devel
+++ kubernetes-server-linux-amd64.tar.gz uploaded (sha1 = 6987c098277871b6d69623141276924ab687f89d)
+++ kubernetes-salt.tar.gz uploaded (sha1 = bdfc83ed6b60fa9e3bff9004b542cfc643464cd0)
Looking for already existing resources
Starting master and configuring firewalls
Created [https://www.googleapis.com/compute/v1/projects/kubernetes-satnam/zones/us-central1-b/disks/kubernetes-master-pd].
NAME                 ZONE          SIZE_GB TYPE   STATUS
kubernetes-master-pd us-central1-b 20      pd-ssd READY
Created [https://www.googleapis.com/compute/v1/projects/kubernetes-satnam/regions/us-central1/addresses/kubernetes-master-ip].
+++ Logging using Fluentd to elasticsearch
The per-node Fluentd pods, the Elasticsearch pods, and the Kibana pods should all be running in the kube-system namespace soon after the cluster comes to life.
$ kubectl get pods --namespace=kube-system
NAME                                           READY     STATUS    RESTARTS   AGE
elasticsearch-logging-v1-78nog                 1/1       Running   0          2h
elasticsearch-logging-v1-nj2nb                 1/1       Running   0          2h
fluentd-elasticsearch-kubernetes-node-5oq0     1/1       Running   0          2h
fluentd-elasticsearch-kubernetes-node-6896     1/1       Running   0          2h
fluentd-elasticsearch-kubernetes-node-l1ds     1/1       Running   0          2h
fluentd-elasticsearch-kubernetes-node-lz9j     1/1       Running   0          2h
kibana-logging-v1-bhpo8                        1/1       Running   0          2h
kube-dns-v3-7r1l9                              3/3       Running   0          2h
monitoring-heapster-v4-yl332                   1/1       Running   1          2h
monitoring-influx-grafana-v1-o79xf             2/2       Running   0          2h
The fluentd-elasticsearch pods gather logs from each node and send them to
the elasticsearch-logging pods, which are part of a
service named elasticsearch-logging. These
Elasticsearch pods store the logs and expose them via a REST API.
The kibana-logging pod provides a web UI for reading the logs stored in
Elasticsearch, and is part of a service named kibana-logging.
The Elasticsearch and Kibana services are both in the kube-system namespace
and are not directly exposed via a publicly reachable IP address. To reach them,
follow the instructions for Accessing services running in a cluster.
If you try accessing the elasticsearch-logging service in your browser, you’ll
see a status page that looks something like this:
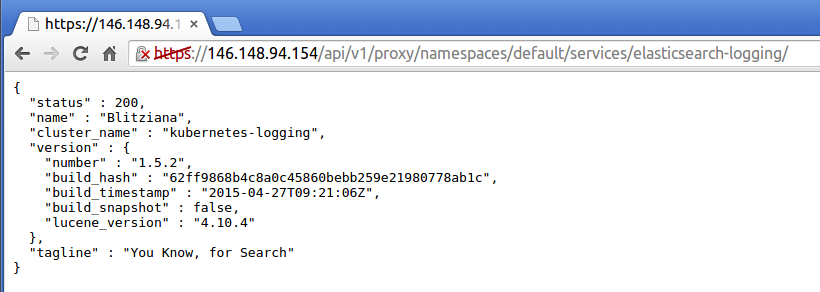
You can now type Elasticsearch queries directly into the browser, if you’d like. See Elasticsearch’s documentation for more details on how to do so.
Alternatively, you can view your cluster’s logs using Kibana (again using the
instructions for accessing a service running in the cluster).
The first time you visit the Kibana URL you will be presented with a page that
asks you to configure your view of the ingested logs. Select the option for
timeseries values and select @timestamp. On the following page select the
Discover tab and then you should be able to see the ingested logs.
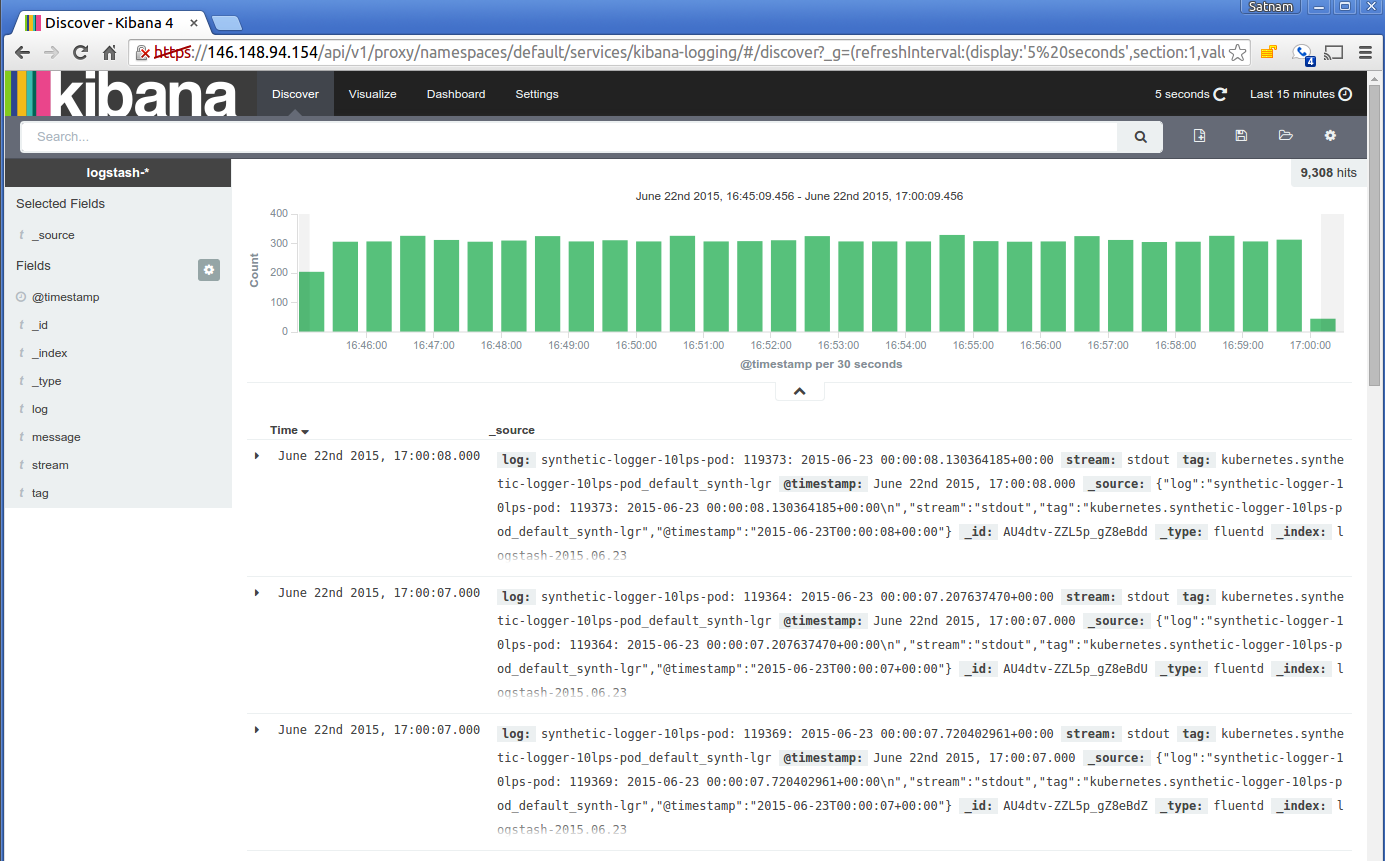
You can set the refresh interval to 5 seconds to have the logs
regularly refreshed.
Here is a typical view of ingested logs from the Kibana viewer:
Kibana opens up all sorts of powerful options for exploring your logs! For some ideas on how to dig into it, check out Kibana’s documentation.